Designing Dashboards for Tablets
As of Argos 4.2, which allows for report execution on any browser, users are now able to run reports from their tablets. Designing a dashboard for tablet use is easy and follows many of the same concepts that are in place for normal viewing on a PC, but there are a few things to keep in mind when designing specifically for a tablet. This topic will primarily focus on designing dashboards for an iPad, but the concepts will work with other types of tablets as well.
Dashboard Size and Layout
The first thing to discuss is that any existing dashboard built in Argos should work just fine with minimal (if any) changes. The main thing to think about is the amount of space to work with on a tablet. Argos sizes a DataBlock based on pixels. On an iPad, use 1024x580. A saved link of the Web Viewer to the Home Screen will utilize the full screen of the tablet and allow 1024x768.
To ensure Argos uses this configuration, set all forms and panels to the appropriate pixel size:
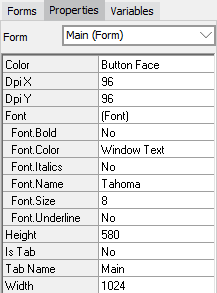
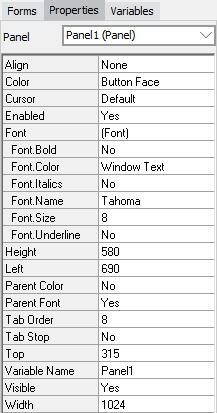
A white background on the panel allows for a clean look when displaying on an iPad, but any background is acceptable. Using the Is Tab option on a form is useful for tablets. This places a navigational tab at the top of your dashboard so you can move to other forms.
Another key concept to maximize space on a dashboard is to simplify the DataBlock. Remove any items that are unnecessary and taking up valuable space. This could include the logo, backgrounds, panels, etc. The breadcrumb trail in the Web Viewer shows the name of the DataBlock, eliminating the need to include it on the dashboard. If a logo is required, use a version sized appropriately.
Design Consistency
The Library of Objects is a repository where objects (and their SQL) can be placed for later use. You can save a single object such as a drop down, or a combination of objects on a panel. You can even store an entire template in the Library, allowing for quick development and a consistent look and feel across different dashboards.
Naming conventions help current and future designers to understand the structure of a DataBlock. If an object has a descriptive name with the form and prefix of the object type, a designer can more easily understand what that object does. For example:
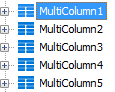
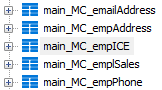
The names on the right will be much clearer to the next person to work on this DataBlock.
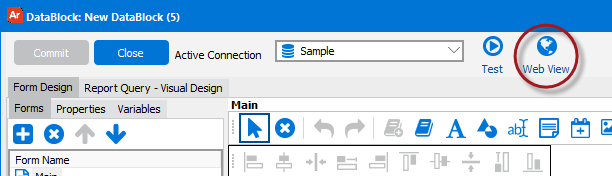
Testing in the Web Viewer
As with any dashboard, it’s a good idea to test it out as you go. Once your dashboard looks good and works smoothly in the Argos client, test it in the Web Viewer. You can use the Web View button in Argos to launch the DataBlock in your PC’s browser.
Finally, test your DataBlock on a tablet and make any adjustments, if necessary.